Defining Environmental Justice Communities: Using CalEnviroScreen in State Policy
How do you know if a place is an environmental justice community? These are neighborhoods surrounded by freeways and industrial facilities, small towns without clean drinking water or sidewalks and excluded from public investments. Cities with nation’s largest refineries, where residents living next door are exposed to more pollution than others who live miles away.
Residents in environmental justice communities don’t just experience pollution from one source. Our lives are not siloed by type of facility or pollutant, however, environmental policy often is. Environmental regulations and decision-making look at pollution sources on a case-by-case basis. In reality, the impacts of pollution, and our ability to cope with a range of health impacts, is compounded by many factors that fall outside of environmental policy: poverty, unemployment, education, and more.
Unfortunately, knowledge of this lived reality doesn’t translate into the policy world. We need tools and data to “make our case” and help bring our voices into the rooms where the decisions on statewide legislation — that have real impacts on our communities and health — are made.
Now, our state should be proud to have a tool that does just that. The California Environmental Health Screening Tool: CalEnviroScreen Version 2.0 (CES 2.0) is a place-based cumulative impact screening methodology created by the California Environmental Protection Agency (CalEPA). CES 2.0 provides one clear, accessible, and science-based way to identify and define communities that are disproportionately burdened by multiple sources of pollution and social vulnerabilities. It looks at 19 indicators to provide a statewide ranking of all 8,000 census tracts in California.
California just released an updated 3.0 version for public comment that continues to improve the tool. In addition to updating CES 2.0 with more recent demographic data, one of the new indicators addresses escalating housing costs and rent burden that many communities are now struggling with, particularly in areas such as San Francisco. Another new indicator will assess rates of cardiovascular disease that often result from constant exposure to high concentrations of pollution. CalEPA, the agency in charge of updating the tool, is also hosting a series of public workshops on the tool, and you can find the schedule here.
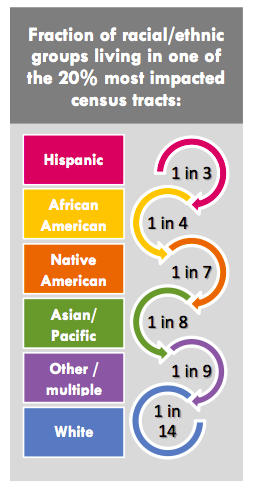
The bad news is that CES 2.0 has confirmed our lived reality: pollution and socioeconomic vulnerabilities disproportionately burden people of color. According to CES 2.0, 89% of people living in the top 10% most overburdened census tracts are people of color. This is the legacy of years of discriminatory redlining in communities of color and systemic racism in industrial development.
The good news is that CES 2.0 is now being used in statewide policies to create explicit commitments to improving our state’s most vulnerable areas. For example, CES 2.0 is being used to determine what areas in the state are eligible for a 25% set aside of climate investments. It is also being used as a way to identify buildings eligible for $100 million in annual investments to bring solar energy to affordable apartment buildings. A bill passed last year requires new hazardous waste facilities to assess cumulative impacts in new permitting decisions.
In the most recent legislative session, new bills passed the legislature that also utilize CES: AB 2722 (Burke) creates a new, large-scale funding program for comprehensive climate projects in environmental justice communities identified by CES 2.0; and SB 1000 requires cities and counties to address environmental justice issues in land-use planning in areas with communities identified by CES 2.0. These are just a few of the types of policies that are using CES 2.0 to try and change the very issues that the tool documents.
Community-based organizations around the state are also using the tool in regional decision-making processes. According to Joy Williams, Research Director at the Environmental Health Coalition in San Diego:
Environmental justice advocates have always recognized that impacts of a changing climate are most detrimental in neighborhoods such as Barrio Logan, City Heights, Sherman Heights, Logan Heights and San Ysidro that suffer from damaging air quality, burdensome energy bills, and inaccessible public transit. We advocated for the City of San Diego’s Climate Action Plan to include a mandate to prioritize the most impacted communities for mitigation and investment, and we recommended that CalEnviroScreen be used to identify impacted communities.
The final Climate Action Plan approved by the City of San Diego includes a directive to pursue policies that address environmental justice in communities identified by CES 2.0 at a regional level. This exciting victory shows how areas and organizations can re-purpose CES 2.0 to meet local environmental and climate justice needs.
Should CES 2.0 be used in every state policy? No. It is a tool that is uniquely suited for identifying environmental justice communities: communities that face the cumulative impacts of high pollution burdens and socioeconomic vulnerabilities. It works well for use in state policy venues such as allocation of funding specifically related to pollution issues and in environmental enforcement and permitting.
Depending on the policy goal decision-makers are trying to achieve, it may make sense to use other tools, or use CES 2.0 in combination with other metrics, to identify the communities who should be eligible for the benefits of a program. For example, a new bill that just passed the legislature, AB 1550 (Gomez), expands the eligibility for the environmental justice set aside of climate investments. If signed into law, areas with communities identified by CES 2.0 or low-income households will be eligible. This allows low-income areas that do not necessarily have a large pollution burden to still benefit from climate investments.
CES 2.0 highlights the reality that there are areas in our state that have a higher cumulative impact than others. That is the sad reality of environmental injustice that we must confront, and that was the purpose of the tool: identify which areas of our state are most highly impacted.
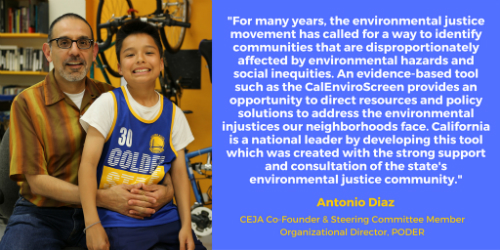
As Antonio Diaz, Executive Director of PODER in San Francisco, says:
For many years, the environmental justice movement has called for a way to identify communities that are disproportionately affected by environmental hazards and social inequities. An evidence-based tool such as CalEnviroScreen provides an opportunity to direct resources and policy solutions to address the environmental injustices our neighborhoods face. California is a national leader by developing this tool which was created with the strong support and consultation of the state’s EJ community.
CES 2.0 is a critical tool to ensure we can effectively advance policies that protect and benefit communities that have been historically overburdened by pollution and poverty.