How impacted is your community?
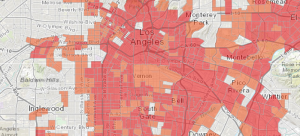
CalEnviroScreen map of the LA area, showing highly impacted neighborhoods like Vernon. Chronic corporate polluter Exide is located in Vernon.
New tool shows maps where are communities with highest pollution and socioeconomic burdens.
From outside the doors of chronic corporate polluter Exide in Southeast LA, to the industrial neighborhoods surrounding Chevron’s refinery in Richmond, you know when you are in a neighborhood overburdened with pollution. You can smell it in the air, you might feel it in your lungs when you take a deep breath, and you see the giant diesel trucks roll by. As you quickly realize, these neighborhoods are not affluent, white suburbs or cleaned-up urban cores. They are working class neighborhoods whose diversity is evident on every corner and overheard in local markets.
But in the disconnected world of state policy, this understanding of what makes an “environmental justice community” doesn’t win us policies or programs to help long-time residents breathe easier or have fewer trucks on their streets. We know that communities of color face a higher burden of pollution throughout California and the state, and even have the data that proves this. But even sympathetic policymakers will ask the question: exactly where are these communities most highly impacted by pollution?
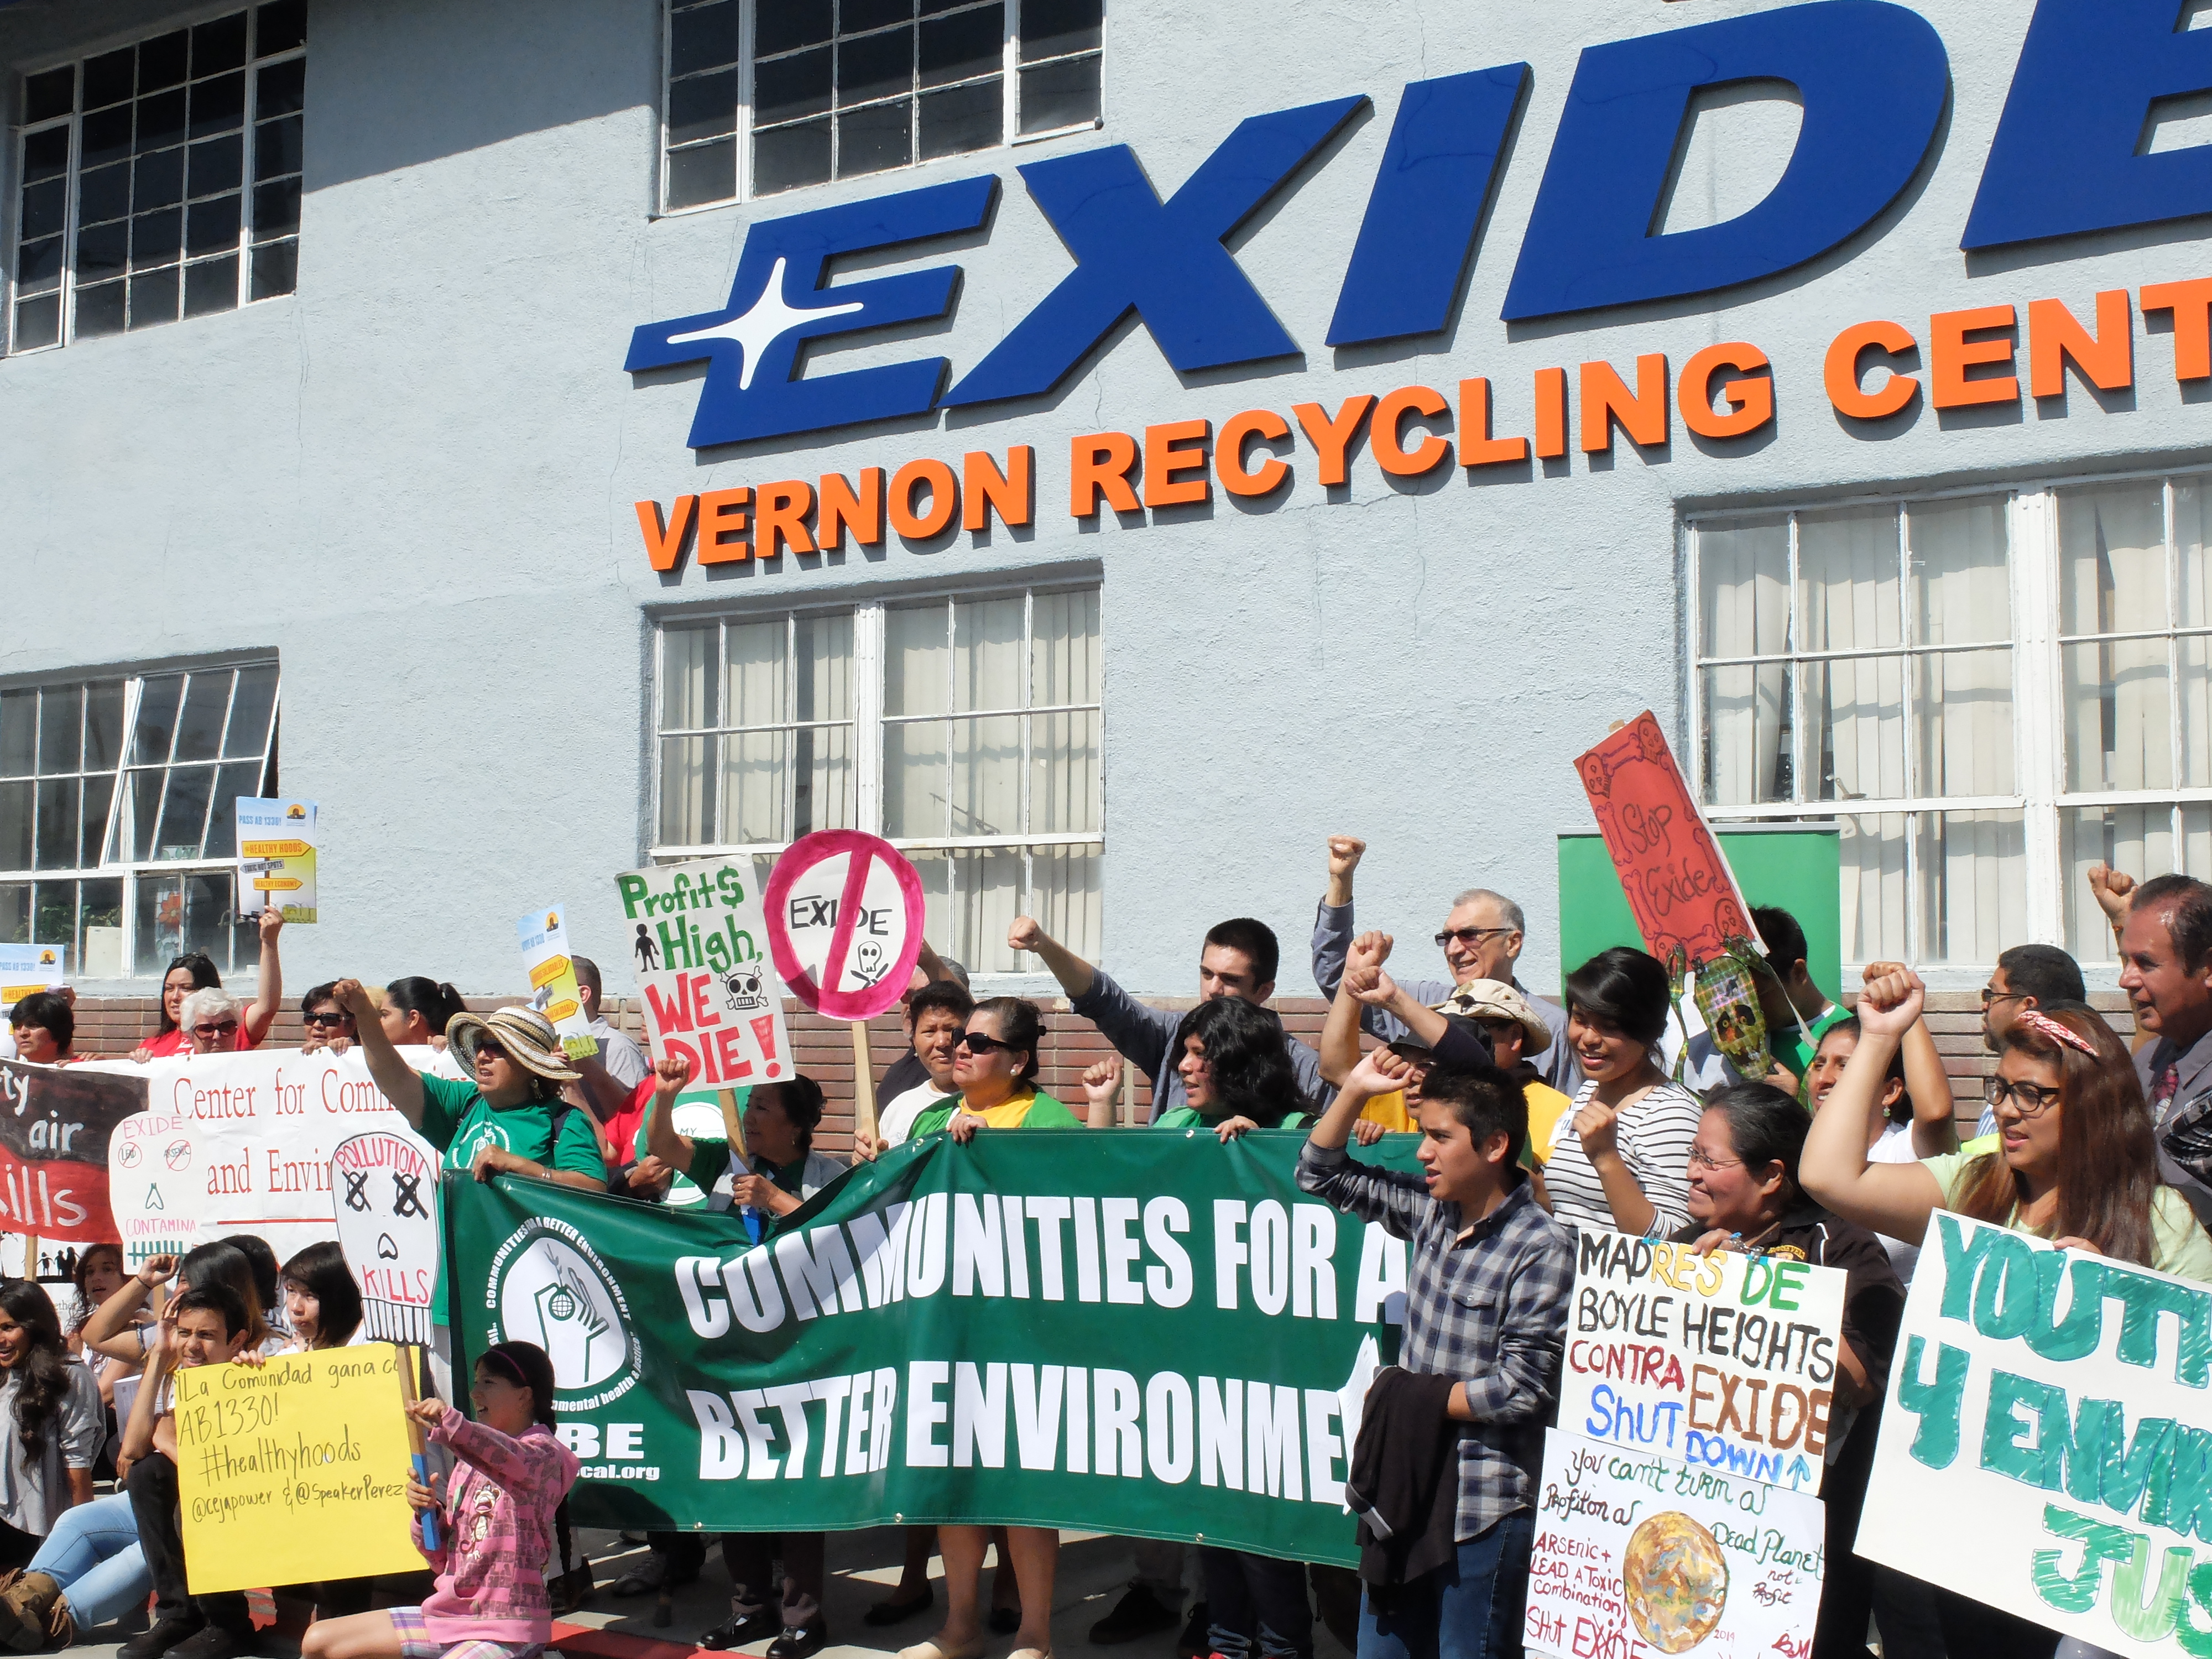
CEJA members outside chronic corporate polluter Exide.
The California Environmental Protection Agency has released a tool that literally demonstrates the answer to this question. The newly released CalEnviroScreen tool examines what combination of pollution burdens, socioeconomic vulnerabilities, and public health issues are present in communities across California and maps the results.
CalEnviroScreen combines 19 indicators, broken into three categories:ollution burdens, such as hazardous waste facilities, socioeconomic indicators, such as poverty and unemployment, and public health indicators such as asthma and low-birth weight. The tool assesses at what level each of these indicators is present in the roughly 8,000 Census Tracts across California. The end result is an online, interactive map that color-codes each Census Tract according to how burdened they are in comparison to other Census Tracts.
Some of the communities that show up in the top twenty percent of highly impacted Census Tracts include much of the Central Valley, parts of San Bernardino, South East LA and communities around the port of LA and Long Beach. In San Diego, the communities of Barrio Logan and parts of National City, and parts of East and West Oakland and Richmond in the Bay Area all show up as highly impacted.
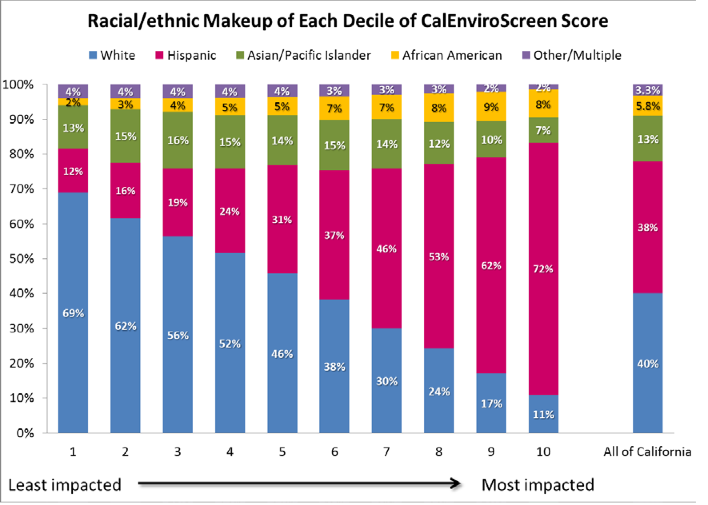
This graph shows how people of color are over-represented in ten percent increments of CalEnviroScreen. Taken from OEHHA’s race/ethnicity analysis of the CalEnviroScreen results.
The tool also shows clearly how communities of color bear a disproportionate burden of pollution: Latinos have a 1 in 2 chance of living in one of the top 20% most impacted areas, African Americans a 1 in 2.5 chance, and Asian/Pacific Islanders have a 1 in 6 chance. Whites have a 1 in 12 chance. In their race and ethnicity analysis of the results, OEHHA finds that “Hispanic/Latinos and African Americans disproportionately reside in highly impacted communities…Whites are over-represented in least impacted communities.”
The CalEnviroScreen tool highlights where are the most vulnerable communities that need an infusion of resources, program attention and innovative solutions to transform them. It paints a picture for policymakers of how a range of issues combine to create an overall burden that is markedly worse in certain areas than others.
A new framework to advance cumulative impacts
The idea that there are a number of impacts in an area, not just one, is something that CEJA and many
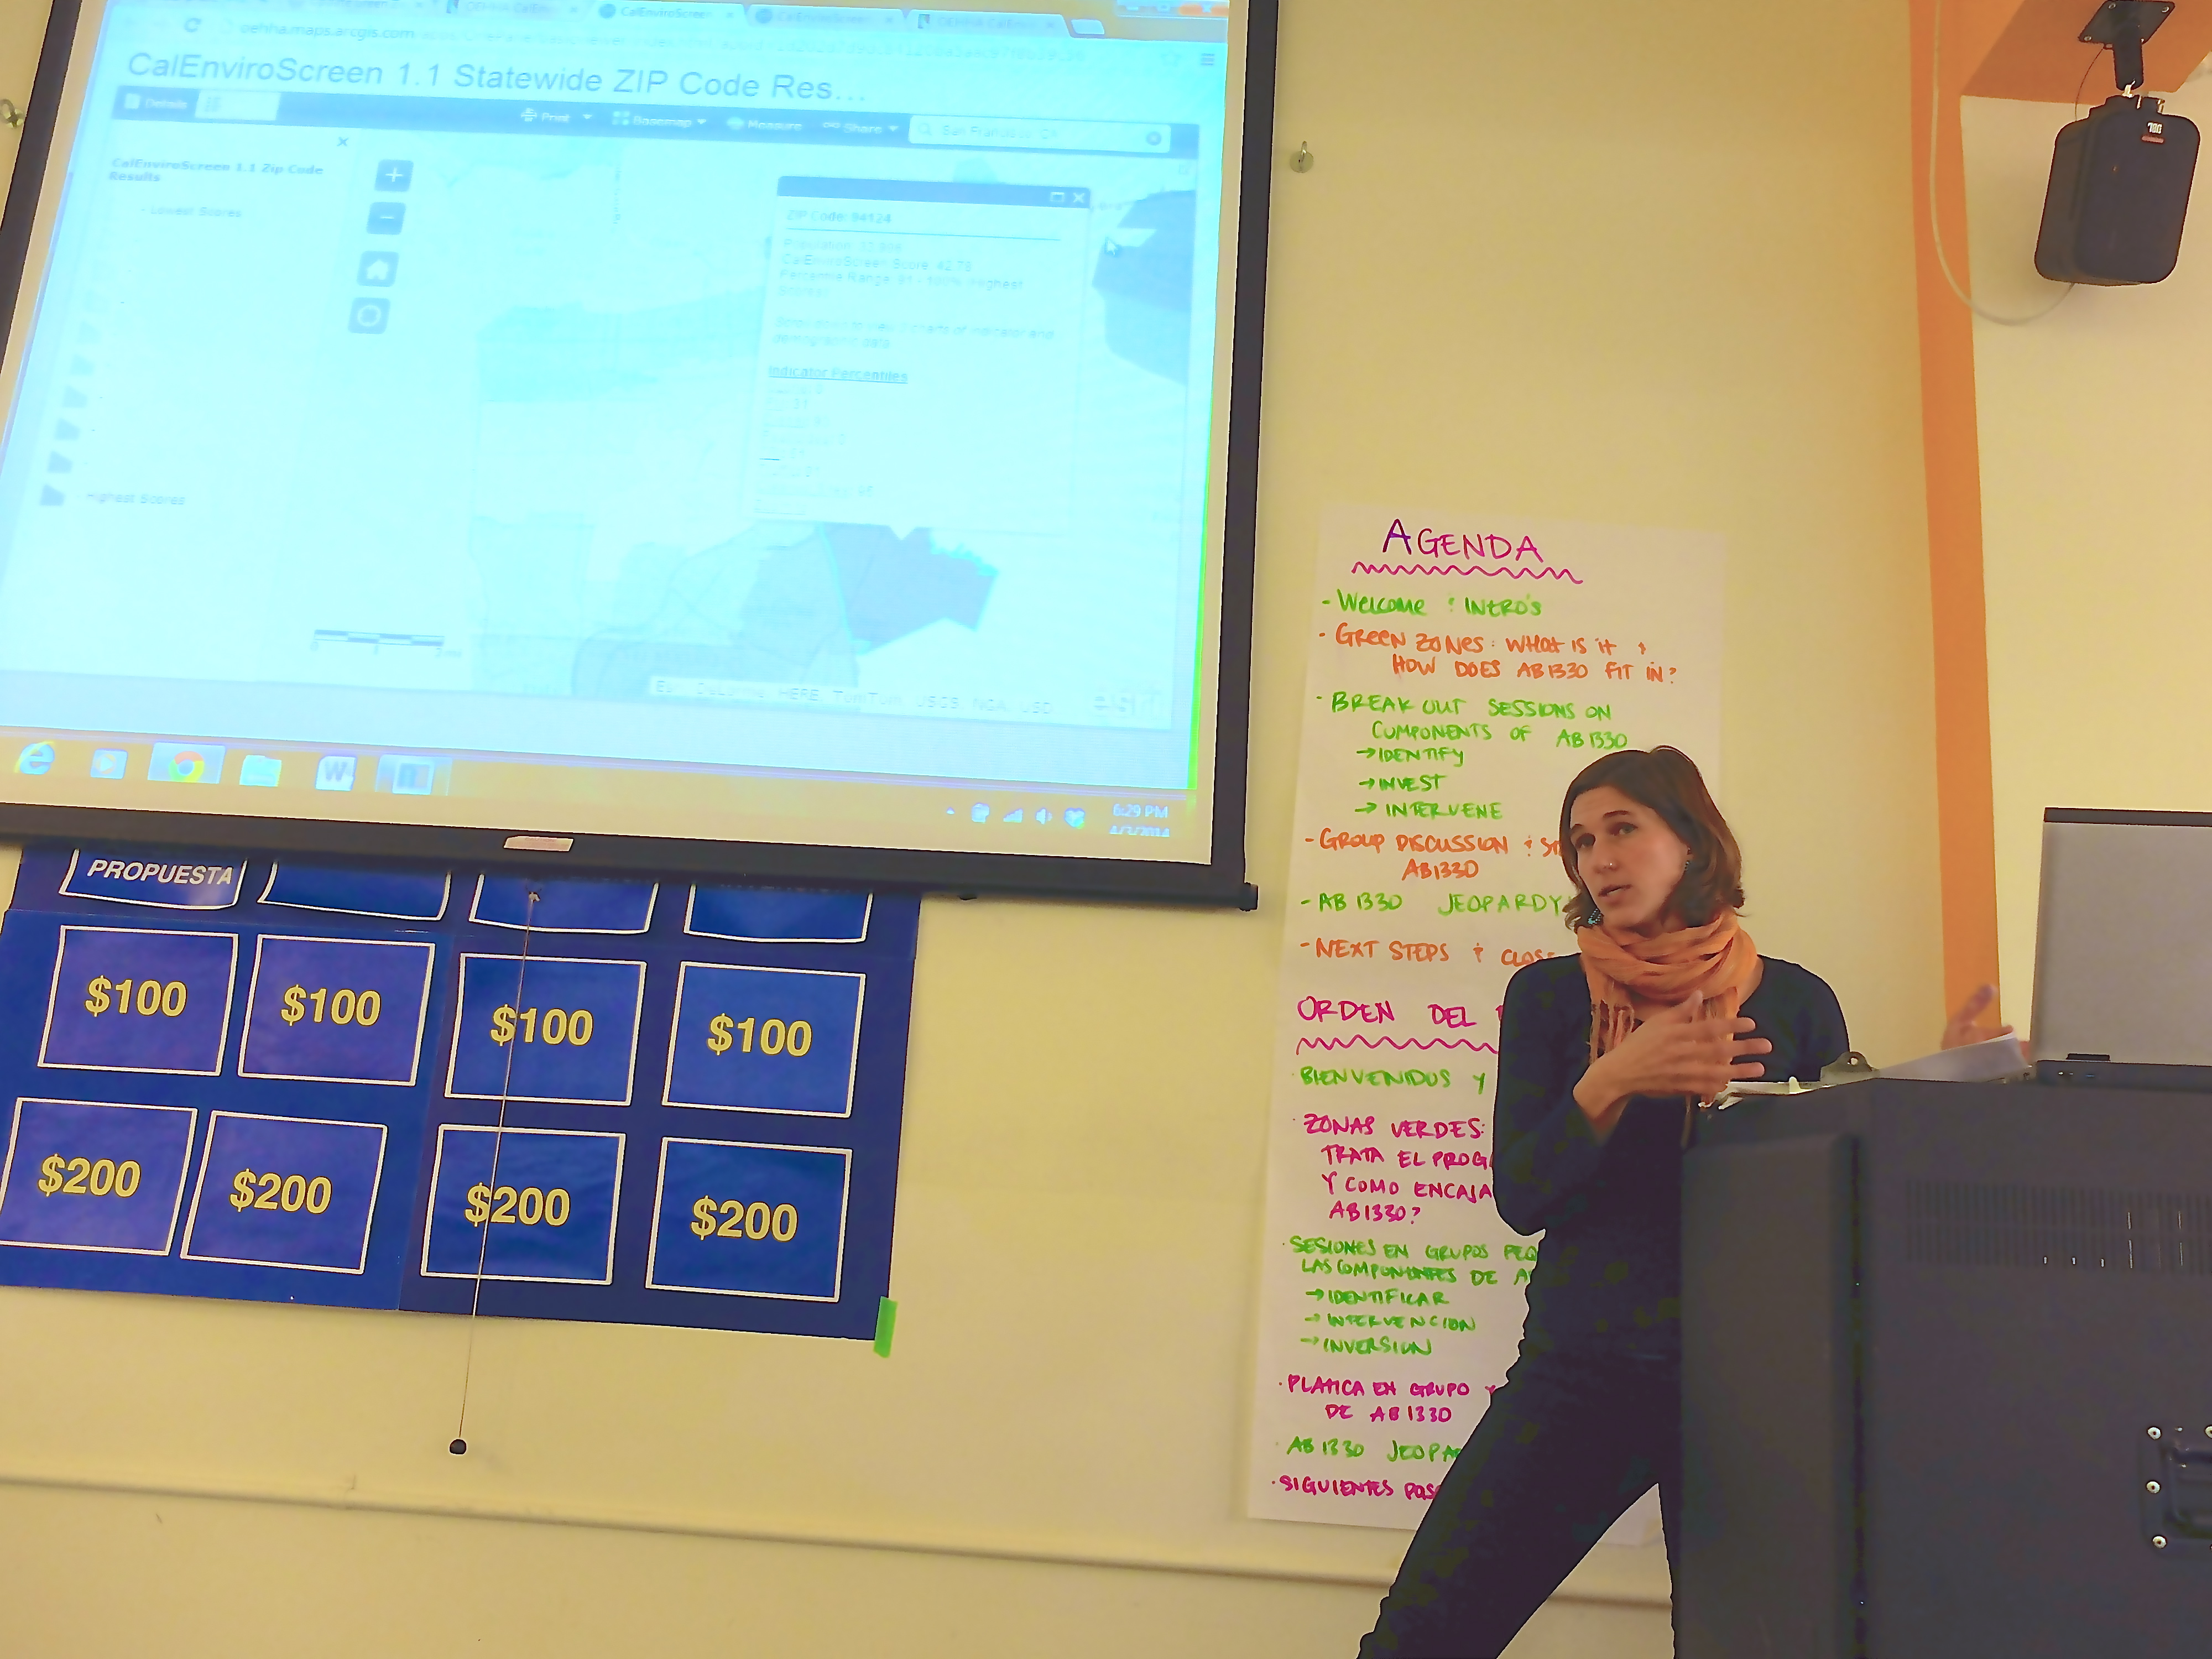
CEJA Coordinator Amy Vanderwarker runs a community training on the CalEnviroScreen tool.
environmental justice advocates have long worked on. When you are living in Southeast Los Angeles, it’s not just air pollution that impacts your quality of life. It’s also the toxic clean-up sites, the high levels of poverty, and the need for good jobs. These issues add up to have a cumulative impact.
Unfortunately, environmental decision-making happens in issue-specific “silos” without taking into account the combined effect of all burdens in an area. By creating a tool that looks at a range of environmental, public health, and socioeconomic issues, CalEPA has provided a new framework to help us drive home the reality that some communities face a higher range of negative impacts than others, and that we need policies that can address this overall problem.
The tool is not perfect. In a state as large as California, it is nearly impossible to find a set of indicators that can capture all the issues that our diverse communities face. Some communities that have long been epicenters of environmental justice organizing do not show up as highly impacted, such as Bayview Hunters Point and Mission District in San Francisco or areas in the Coachella Valley. The communities identified by the tool are not the only communities that need deep interventions from our government agencies. But CalEnviroScreen without a doubt highlights areas that are in need, and helps make the case that is time to start transforming these toxic hotspots into healthy hoods.
CalEPA is accepting public comments on the latest version of the CalEnviroScreen tool until May 23rd.
More on the CalEnviroScreen tool
Office of Environmental Health and Human Hazard Assessment’s CalEnviroScreen website: http://oehha.ca.gov/ej/ces2.html
Two good articles on the tool: Modesto Bee and LA Times.