CalEnviroScreen debate signals new focus on environmental justice in state policy
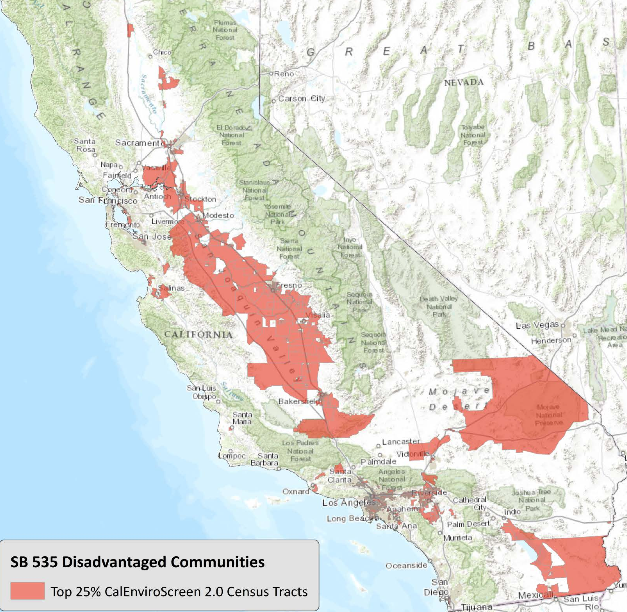
Map of the top 25% most highly impacted communities from CalEPA’s new guidelines
Nothing like the promise of millions of dollars to turn folks out, create a whole lot of confusion and yes, incite some fighting. This past year saw an unprecedented amount of discussion around a fairly technical tool that CEJA has spent years working on, which we honestly never thought would rise to its current level of statewide popularity: the cumulative impact screening tool, CalEnviroScreen2.0. The statewide discussion around the tool and its uses, particularly in the distribution of climate change revenues, has sparked a spirited debate that has engaged hundreds of community groups across the state.
On Friday October 31st the California Environmental Protection Agency announced that, as expected, it will use the statewide cumulative impact screening tool, CalEnviroScreen2.0, to define “disadvantaged communities” for the purposes of distributing climate change funding. The top 25 percent of communities identified by this tool will be considered “disadvantaged” for the purposes of the set aside within the Greenhouse Gas Reduction Fund. Check out this and this article quoting CEJA, and the full guidelines can be found here.
Millions in new funding ignites months of CalEnviroScreen discussion
In 2014, there was a rare occurrence in California: a new revenue stream of hundreds of millions of dollars – $872 million, to be exact, with more anticipated in future years — being funneled to state agencies through the newly implemented cap-and-trade program to curb greenhouse gas emissions. With 25 percent of these revenues slated for “disadvantaged communities” (thanks to the 2012 bill authored by then-Senator Kevin de León, SB 535), how “disadvantaged community” is defined took on a lot more importance to a lot more people than it ever has in the past.
What we saw over the course of the year – both in Spring negotiations over the budget and then again during the summer when the state rolled out a public process to develop guidelines for distributing the climate revenues – has been a statewide fight over how to best define, essentially, environmental justice communities.
CalEnviroScreen2.0 assesses what areas in California are most heavily impacted by 19 indicators of pollution burden, socioeconomic vulnerabilities, , and public health risk factors. The tool ranks the roughly 8,000 Census Tracts throughout the state according to how many of these indicators are present and at what levels, and compiles it all into an online, interactive map.
For CEJA, use of CalEnviroScreen was not a surprise. We have been working on the development of CalEnviroScreen for several years now and are very familiar with how it works. But for many groups, it was the first time they had ever heard of the tool, and it has been a sharp learning curve to understand how it works and why we need it.
The many interests at stake in the definition of “disadvantaged communities”
The conversation has been messy, but important.
We saw regions pitted against regions, each area trying to get the “most” money possible by ensuring the definition of disadvantaged communities contained as many Census Tracts in their area as possible. In the Central Valley and Los Angeles, there are many Census Tracts that show up on CalEnviroScreen2.0’s top 25 percent. In the Bay Area, there are a lot less so local agencies and legislators from the Bay Area were pushing to throw out use of CalEnviroScreen and undermine the science behind it.
Meanwhile, Central Valley legislators in particular got incensed at the perceived “grab” of their potential resources, prompting such memorable quotes as: “The State made a promise to invest in the long-term health of our most disadvantaged communities, but at the last minute, a cash grab from the wealthiest areas of the state is letting politics trump that promise,” from Assemblymember Adam Gray, and “While coastal communities worry about freeing whales, we are worried about underweight births and childhood asthma,” from Assemblymember Kristin Olsen, both reported in a June 2014 Turlock Journal article.
It is one thing for our legislators and local agencies to fight one another, but it takes a turn for the worse when community groups get pulled into the mix. As many groups became concerned that the communities where they work would not be eligible for funding, and local agencies such as the Bay Area Air Quality Management District tried to organize groups to oppose CalEnviroScreen2.0, it started to look like a community vs community fight for funding, which never helps our overall movement.
The irony is that all this fighting over the 25 percent is overlooking two critical facts:
- We are all arguing over the smallest portion of the money! A full three-quarters of the climate revenues are available to any project that meets the guidelines in any part of the state.
- The funding process is competitive. Even if you live in a community that qualifies for the 25 percent set-aside, you still must compete with other applications across the state. There is no guaranteed funding.
The big picture: a statewide perspective to ensure environmental justice communities are accurately identified
For CEJA, the bottom line has always been: are the communities that we know to be “environmental justice” communities – criss-crossed by freeways, covered in a patchwork of factories, refineries and warehouses, saddled with high poverty and chronic unemployment – are these areas identified by CalEnviroScreen2.0? The question should NOT be: will my region get as much money as possible through this definition?
And the answer to CEJA’s question, unfortunately, is not 100 percent yes. There are places that have long, rich histories of documenting and organizing against environmental injustices that are left out, such as Bayview Hunters Point in San Francisco and Mecca in the Coachella Valley.
But as we have made the case many times over, CalEnviroScreen is an important step in the right direction. We need to identify areas that are most impacted and target these areas for statewide resources, investments, and pollution reduction efforts. CalEnviroScreen gives decision-makers a clear, credible scientific methodology to do so.
In our five years of working CalEnviroScreen, we have also seen a commitment from CalEPA to continue improving the tool. Just recently, they have been working to address the complicated issues of gathering accurate data on pollution along the border. We will continue our work to ensure all environmental justice communities in California are identified by future versions of CalEnviroScreen.
Debate reflects progress in statewide policy on environmental justice issues
It been exciting to see many more people and groups engaged in what CEJA considers one of the most important statewide conversations on environmental justice issues: how do we define overburdened areas accurately? More broadly, the 2014 CalEnviroScreen fight highlights a major shift in statewide policy around environmental justice issues: more and more, state policies are creating explicit commitments to the state’s most vulnerable areas, using the term “disadvantaged communities.” To the best of our knowledge, this term first showed up in state statute back in 2009 in an effort to target regional water planning money to communities most in need (SB 626, Eng).
While we may not love the term (or even worse, its acronym: “DAC”) because it is, in essence, a sanitized reference to the low-income communities and communities of color where CEJA, our members, and our allies have been working for years, the growing prevalence of the idea in policy signals positive movement towards environmental justice on a statewide level.
Here are just a few examples of where the concept has been used to ensure EJ communities are included in statewide policy:
- the newly created “Green Tariff Shared Renewables” program (SB 43, Wolk) requires a carve-out of new solar megawatts to be located directly in “disadvantaged communities”
- the big renewable program extension and electricity rate reform bill of 2013, AB 327, requires the California Public Utility Commission to ensure there are programs that benefit “disadvantaged communities” within the big utilities
- the Active Transportation Program at the California Department of Transportation, which funds bike and pedestrian infrastructure projects among other things, requires a minimum of 25 percent funding for disadvantaged communities, thanks to the hard work of many allies.
- This year, the negotiated water bond contains dedicated drinking water and technical assistance funding for “disadvantaged communities” (though a different definition is used), again thanks to the hard work of our allies in the water world.
We are optimistic that the overall trend of including our communities – whether your call them disadvantaged communities, overburdened communities, or environmental justice communities – in state funding decisions and other policies will ultimately lead to biggest win of all: improved health and environmental conditions in communities most highly impacted by pollution and climate change across the state.